Ag Tech Sunday - Indigo's Living Map of the World's Food System
- By: "Farm Tender" News
- Ag Company News
- Jun 29, 2019
- 1000 views
- Share

This article is bought to you by Bruce Robertson Transport.
By David Potere
Two weeks ago, at the inaugural Beneficial Ag event in Memphis, Indigo was proud to participate in a growing community of innovators from across the food system. One of the questions we asked ourselves was, “What are the technological capabilities needed to catalyze the beneficial agriculture movement?” We believe a new way for seeing the global food system is part of what’s needed next. That’s why we’re building Indigo Atlas – a geospatial platform for solving agricultural problems at a planetary scale. Here, I will explain why Atlas is important, give a glimpse of the technology under the hood, and share some recent examples of Atlas in action.
Ad - For all you Hay and Grain Cartage call Bruce Robertson Transport - Australia wide - Ad
Ad - For all you Hay and Grain Cartage call Bruce Robertson Transport - Australia wide - Ad
Bridging the digital divide between urban and rural areas
Crops change all the time, and span half of the Earth’s habitable surface. This dynamism makes mapping and monitoring our food system much more challenging than digitizing our cities. The result is a stark urban-rural digital divide.
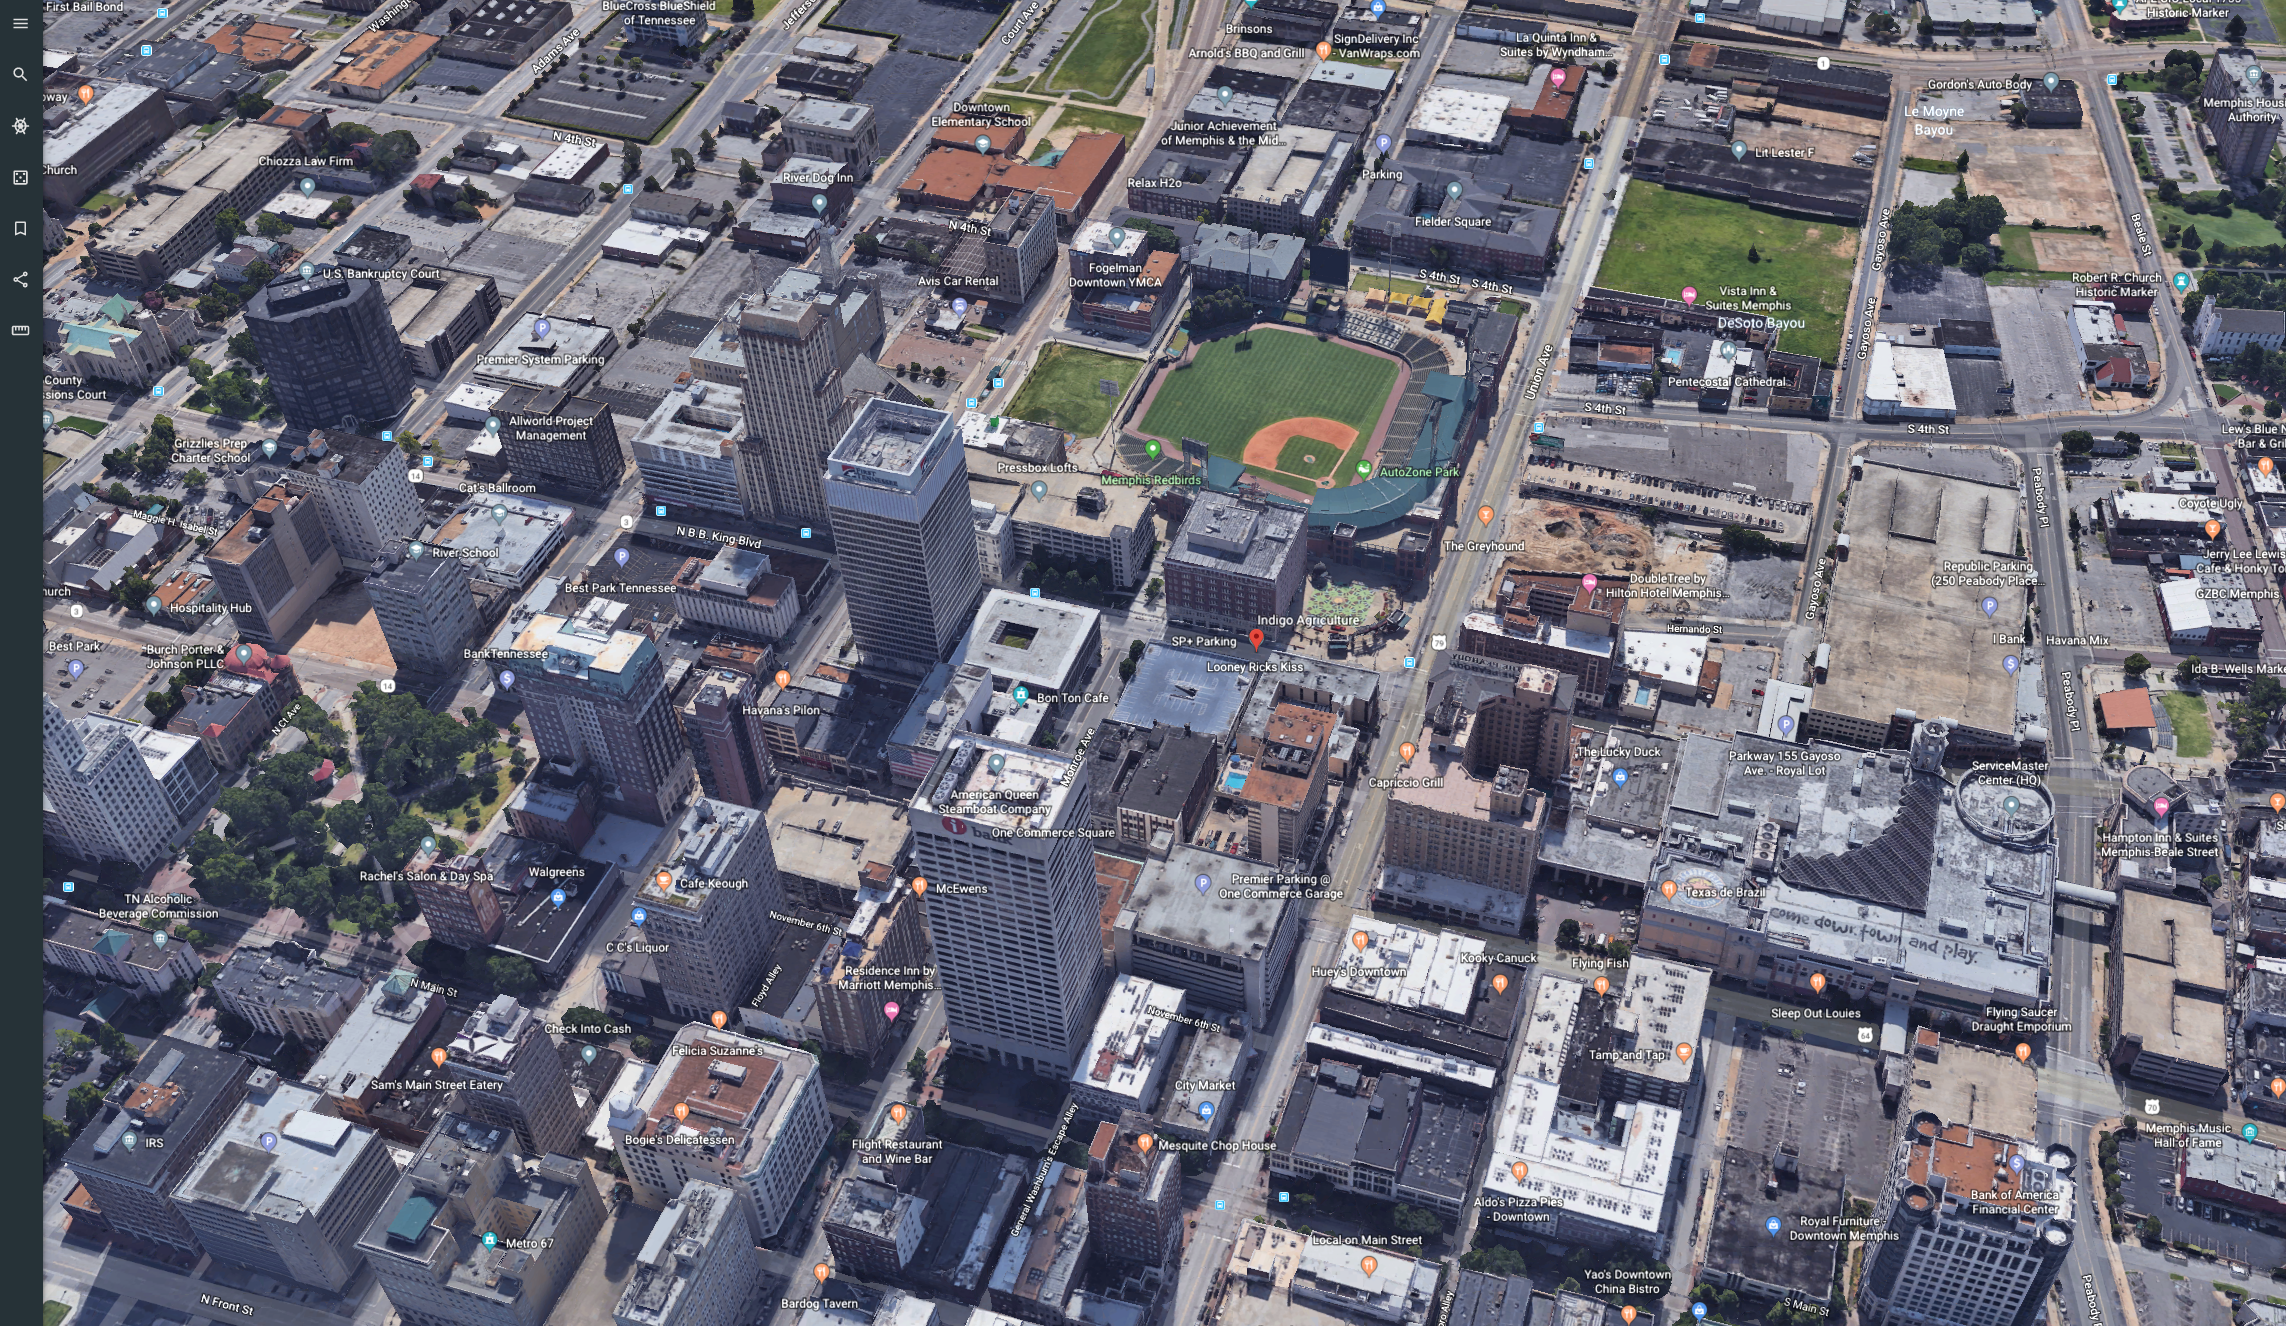
Credit: Google Earth
Launch Google Earth for Memphis and you’re surrounded by a searchable, up to date, digital model for all of the places where we live, work, and play. In organizing the Beneficial Ag event earlier this month, our team did not begin by sending field specialists to map the streets of Memphis. Instead, we took for granted that all of our hundreds of guests could plan their travel using consumer apps and services that are powered by a complete digital model of the city.
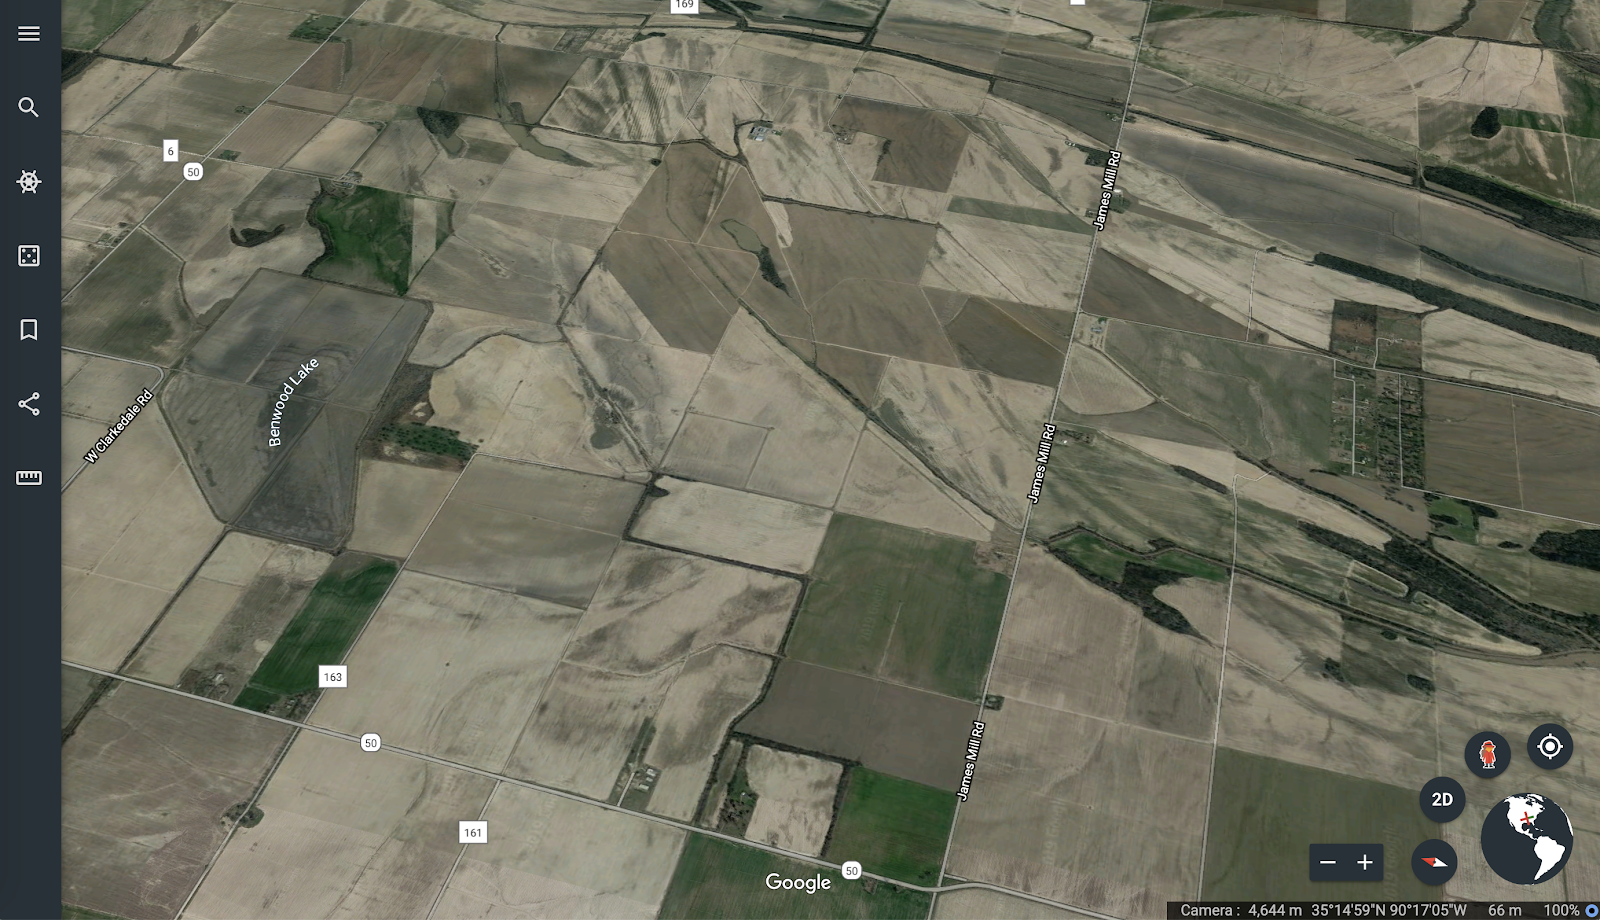 Credit: Google Earth
We don’t have that luxury when it comes to solving agricultural problems. Zoom out from Memphis to farms nearby in the Mississippi Delta, and then try searching for “cotton field” within Google Maps – you will be waiting a while! The fields, farms, and grain bins that power one of the most fertile farming regions in the world are literally off the map. In many places, farmers still turn to 19th century Platt books for basic facts on land parcels. This data desert extends beyond the U.S. to all of the places that matter in the world’s food system.
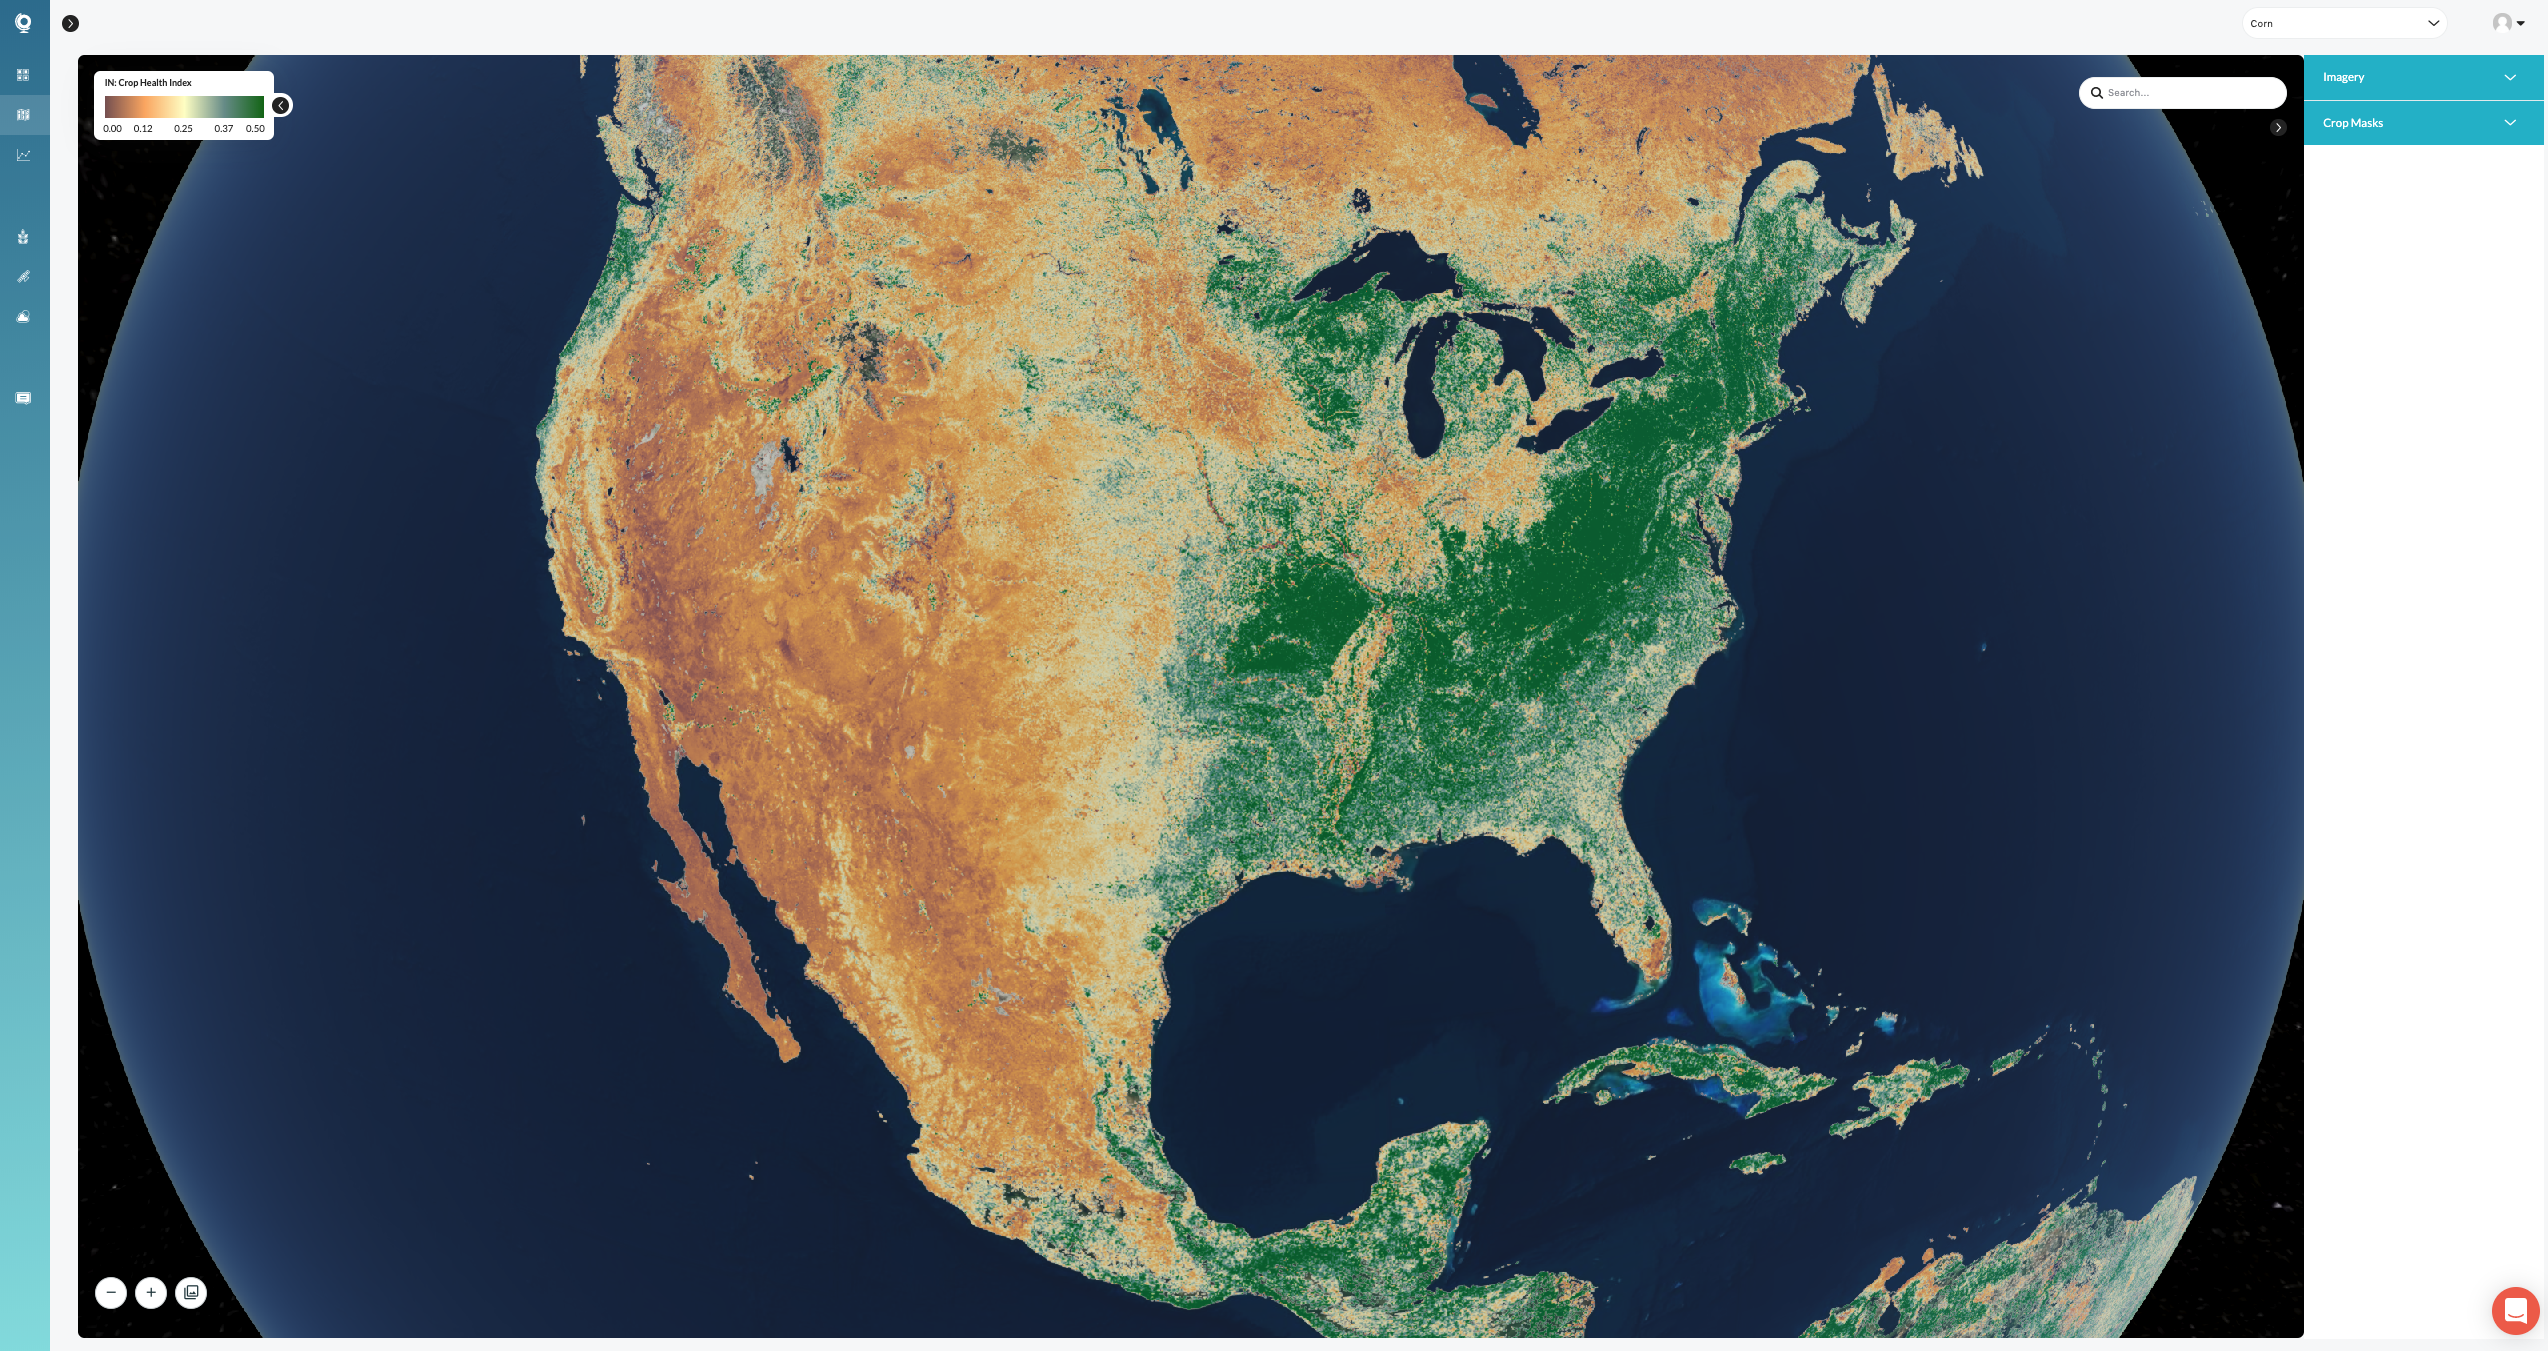
To make beneficial agriculture a reality, we need a living map our food system. We need to see the hundreds of millions of fields that are taken into cultivation by billions of farmers each year. Few of us anticipated how transformative a living map of the consumer world would be; imagine the apps and digital services we can build when we have a searchable, consistent mapping service of the world’s farm fields.
Ad - For all you Hay and Grain Cartage call Bruce Robertson Transport - Australia wide - Ad
Ad - For all you Hay and Grain Cartage call Bruce Robertson Transport - Australia wide - Ad
What powers the technology?
Building a living map of the world’s food system is only now possible because of breakthroughs in our ability to follow the harvest across three distinct sources of truth:
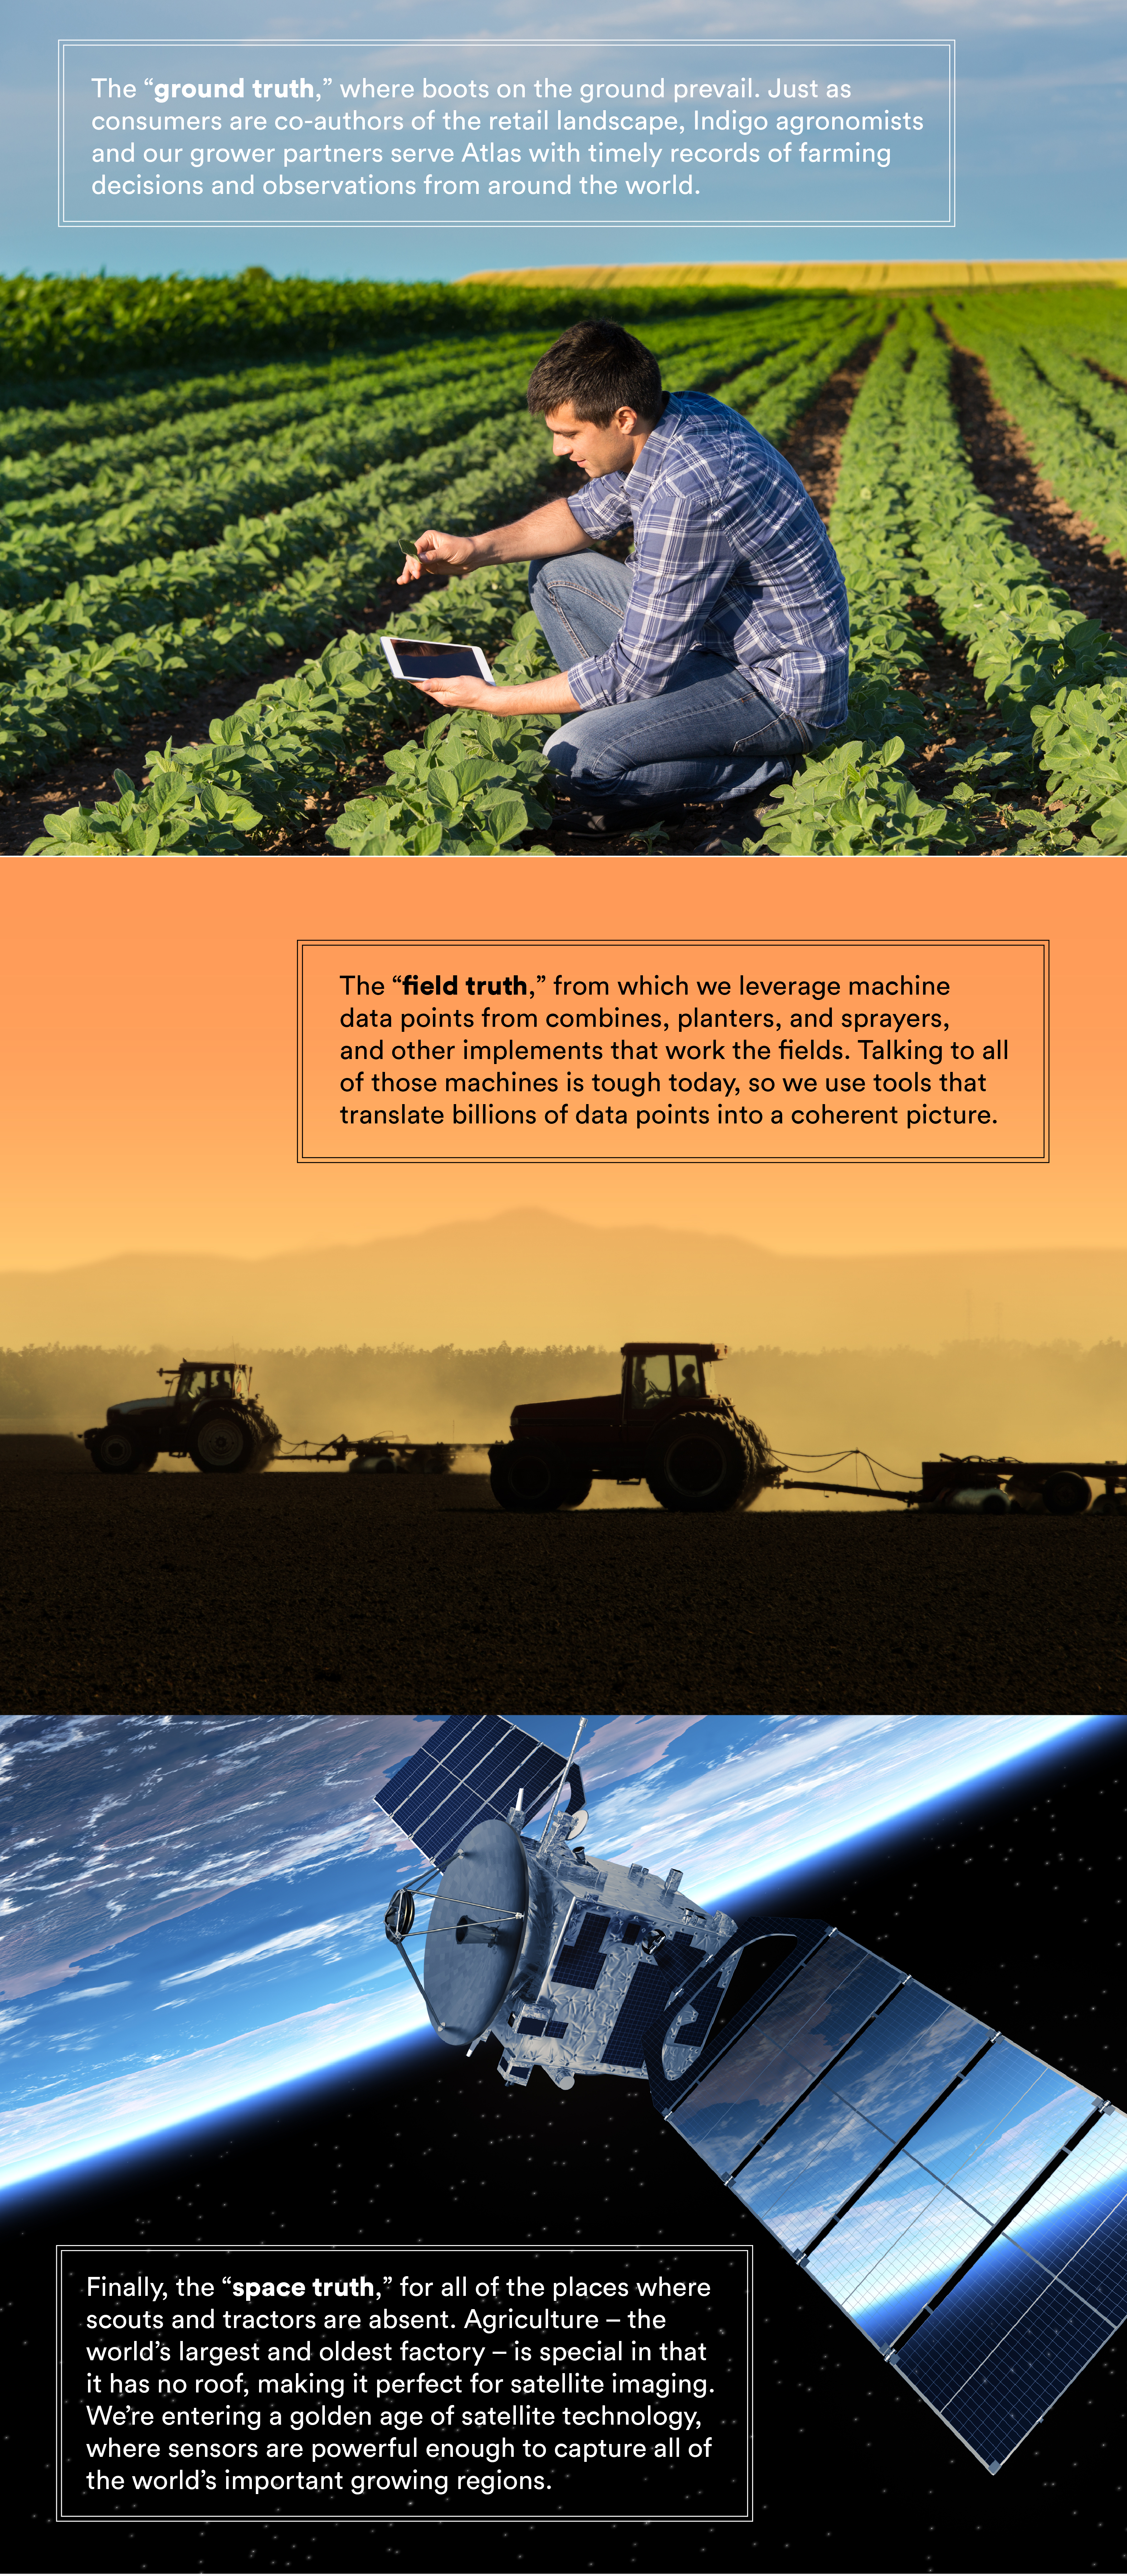
Out of the box, few of these sources are ready for practical work. They are messy, incomplete, and poorly calibrated. But we can change that by bringing the terabytes of data together in one reference system, standing that system up with machine learning, and connecting that database to humans – where they can be the final arbiters of truth. This creates a virtuous feedback loop among these sources that makes the whole more trustworthy and useful.
Ad - For all you Hay and Grain Cartage call Bruce Robertson Transport - Australia wide - Ad
Ad - For all you Hay and Grain Cartage call Bruce Robertson Transport - Australia wide - Ad
Atlas in action
Indigo Atlas is already starting to made a difference across local, regional, and national scales – let’s take a brief tour.
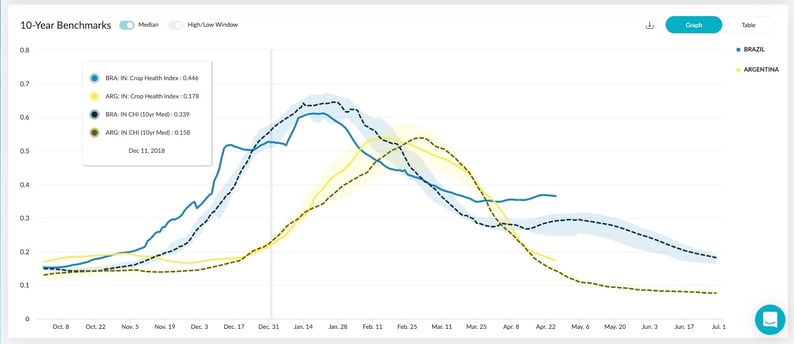
Atlas connects satellites feeds with our global crop maps to take a pulse on the world’s food production. Every day, it scans plant canopies across agricultural lands to check progress and conditions, while making comparisons against more than a decade’s worth of historical information. The result looks a lot like an EKG readout, where the “heartbeat” shows what we call the Crop Health Index (CHI).
For individual fields, CHI can bring objectivity to agronomic decision making. When combined at national scales with other data sources like weather and government crop reports, it acts as training data for machine learning models. These models allow us to forecast end-of-season yields for more than a quarter of human calories – a number that is steadily rising.
.gif?width=836&name=Ind2017CornModel%20(1).gif)
While there is no such thing as a crystal ball when it comes to yield forecasting, Indigo Atlas has a strong track record over the past three seasons. As an example, above is the Atlas forecast for U.S. corn in 2017. Our models anticipated US record-yields more than four months ahead of USDA and market consensus. Imagine what this engine can do for the buyers and sellers who meet each other in Indigo Marketplace.
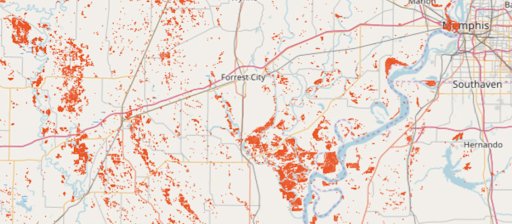
Zooming into the regional stage, Atlas served as an aid in the extreme floods plaguing the U.S. corn belt this year. Our team combined Atlas flood maps with our planted area models and spaceborne farm storage maps to estimate damaged grain bins and farmland, county by county. These findings were shared with the government task forces speeding recovery dollars to farmers.
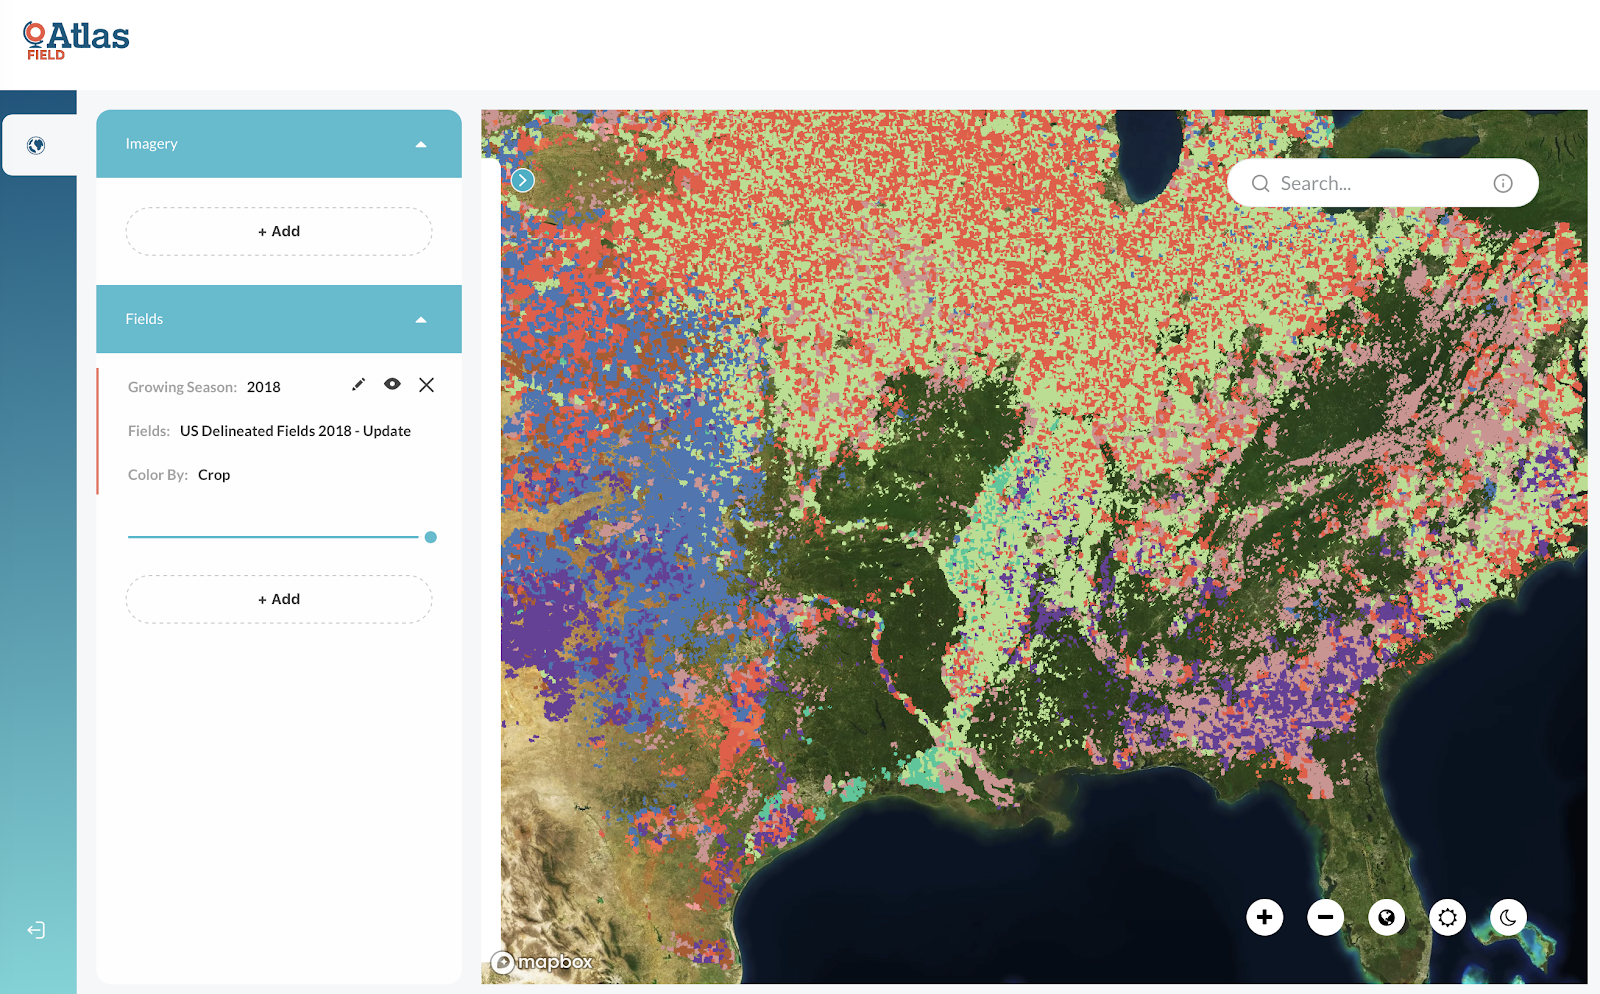
Finally – individual fields. Atlas capabilities were first applied to measure the effect of Indigo microbial seed treatments across more than 40,000 commercial acres of wheat. Since, we have scaled our systems more than 5,000 times; Atlas technology now draws 20,000,000 US fields when fueling agronomic insights for our growers and agronomists.
Ad - For all you Hay and Grain Cartage call Bruce Robertson Transport - Australia wide - Ad
Ad - For all you Hay and Grain Cartage call Bruce Robertson Transport - Australia wide - Ad
Looked at together, these three examples offer a glimpse of Indigo Atlas’ capabilities. Building a mapping technology that is up to the challenge of a more beneficial ag system is a tall order. But in doing what’s required, we will build something lasting – a living map of the world’s food system


Share Ag News Via